Page 1 of 1
More details WIN_OLEAUTO information in debugger
Posted: Thu Jul 09, 2020 3:24 pm
by FWExplorer
Hi,
I'm working through a minigui project uses
win_oleCreateObject( "Outlook.Application" )
to connect to the installed Outlook app, and filter out certain email messages & subjects, and then search through a spreadsheet & do some other stuff.
In the minigui debugger, the outlook object - and other related objects - show up as just
Class WIN_OLEAUTO object
, and when you click on it, it doesn't display any details about the object. It'll just pop up a message that the
Value cannot be edited.
I coded an equivalent script in VBScript. When I examine the objects in the VBSEdit debugger, it displays all the Methods & Properties, with details about the internal arrays, & so forth.
So -
Is there a better debugger for Harbour, that shows more information
or
Is there a better function than win_oleCreateObject() - either in a Harbour contribution library, or in Fivewin - that shows more details about Ole objects that are being used?
Re: More details WIN_OLEAUTO information in debugger
Posted: Thu Jul 09, 2020 4:55 pm
by Rick Lipkin
Try connecting to outlook like this
Code: Select all
oOutLook := TOleAuto():New("Outlook.Application")
Rick Lipkin
Re: More details WIN_OLEAUTO information in debugger
Posted: Thu Jul 09, 2020 5:43 pm
by FWExplorer
That's definitely an improvement, thanks Rick.
Unfortunately, it still doesn't have the same level of specific details, as other environments. It lists some generic methods in the object, but doesn't display some of the subobjects, like folders.
So e.g. the VBScript statements
Code: Select all
Set objOutlook = CreateObject("Outlook.Application")
Set objNamespace = objOutlook.GetNamespace("MAPI")
Set colFolders = objNamespace.Folders
return objNamespace object with methods like GetDefaultFolder(), and GetAddressEntryFromID(),
along with a Folders object, containing Methods like
Add(), GetFirst(), GetLast(), and a count property.
In contrast, the Harbour objects in the debugger (class TOLEAUTO) contain generic class methods like
callmethod
get
getactivobject
getproperty
__enumskip,
and many others.
Anyway, thanks for the help. It's possible I'll just have to use both environments, while building & debugging.
Rick Lipkin wrote:Try connecting to outlook like this
Code: Select all
oOutLook := TOleAuto():New("Outlook.Application")
Rick Lipkin
Re: More details WIN_OLEAUTO information in debugger
Posted: Sat Jul 11, 2020 4:27 am
by Antonio Linares
Re: More details WIN_OLEAUTO information in debugger
Posted: Sat Jul 11, 2020 2:12 pm
by FWExplorer
Thanks, Antonio.
Btw, which is a good GUI debugger for Harbour? The default console debugger is ok but sometimes inconvenient, especially when you have 2 monitors. If you try to move the debugger to the larger non-default monitor, all of the lines get skewed & unreadable.
I'm using a third party Harbour development tool & debugger (I won't mention the name here), for individual snippets with bugs. But is there a decent gui debugger for Harbour?
Does FiveEdit have Single-stepping capabilities? I tried using it, but it keeps complaining about missing FLVs when it loads, even though all of the bundled FLVs are in the same directory as the FiveEdit executable.
Regards,
Re: More details WIN_OLEAUTO information in debugger
Posted: Sat Jul 11, 2020 5:53 pm
by Antonio Linares
You can use Microsoft vscode + Harbour debugger extension from Antonino Perricone
Re: More details WIN_OLEAUTO information in debugger
Posted: Sat Jul 11, 2020 9:45 pm
by cnavarro
FWExplorer wrote:Thanks, Antonio.
Does FiveEdit have Single-stepping capabilities? I tried using it, but it keeps complaining about missing FLVs when it loads, even though all of the bundled FLVs are in the same directory as the FiveEdit executable.
Regards,
Excuse me, what are FLVs?
If you want to learn how to install and use FivEdit, log in to slack and one of my registered partners and I will surely be happy to help you install it quickly.
This is link to slack of FivEdit:
https://join.slack.com/t/fivedit/shared ... Lfk3IQxVBA
Re: More details WIN_OLEAUTO information in debugger
Posted: Sun Jul 12, 2020 11:05 am
by FWExplorer
Thanks, but I was only interested in FiveTech, to see if it has internal debugging capabilities.
The errors are regarding FIVs, as in fivedit17.fiv. The 'i' looked like an 'l' with the font I have.
Anyway, I think I see what the problem is. FivEdit expects to be in the C:\FivEdit folder. I have it elsewhere, so it's complaining, e.g.
File definition .fiv : C:\FIVEDIT\borland73.fiv not found.
Anyway, I''ll just continue using the Third Party debugger, for individual modules with errors.
Regards,
cnavarro wrote:FWExplorer wrote:Thanks, Antonio.
Does FiveEdit have Single-stepping capabilities? I tried using it, but it keeps complaining about missing FLVs when it loads, even though all of the bundled FLVs are in the same directory as the FiveEdit executable.
Regards,
Excuse me, what are FLVs?
If you want to learn how to install and use FivEdit, log in to slack and one of my registered partners and I will surely be happy to help you install it quickly.
This is link to slack of FivEdit:
https://join.slack.com/t/fivedit/shared ... Lfk3IQxVBA
Re: More details WIN_OLEAUTO information in debugger
Posted: Sun Jul 12, 2020 11:08 am
by Antonio Linares
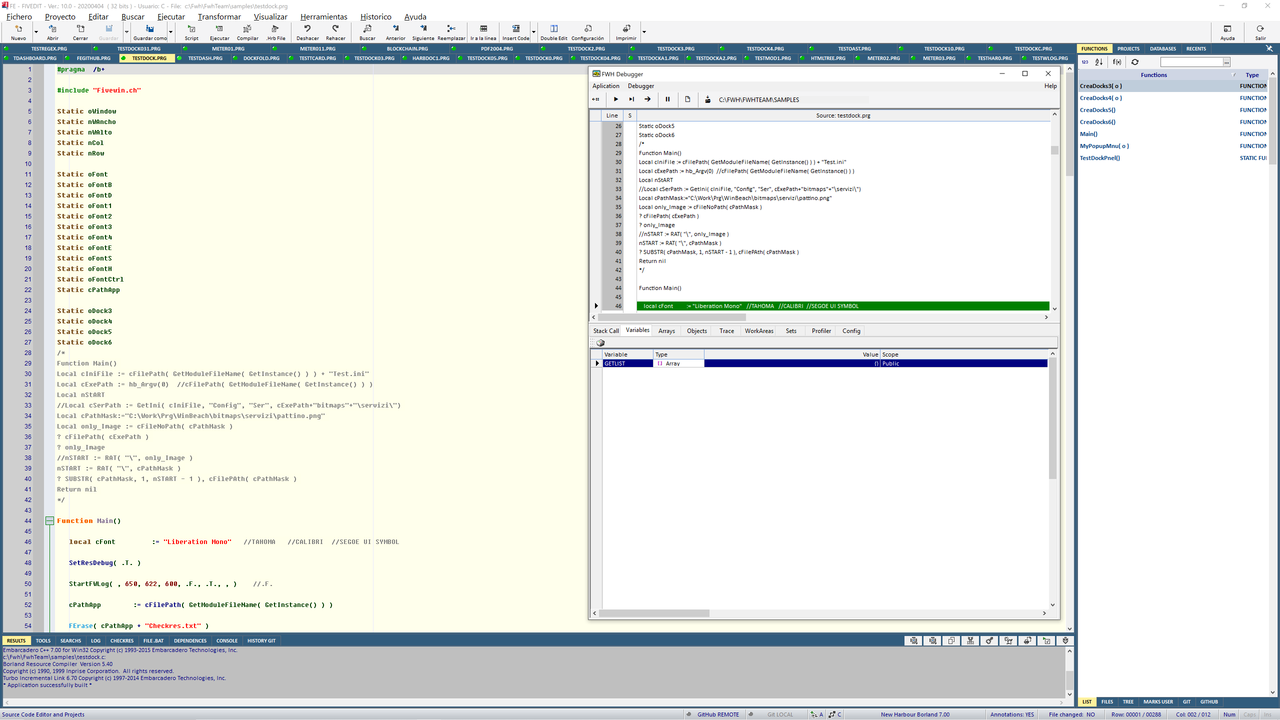
FWH has its own debugger, you only have to build using /b, in example:
buildh tutor01 /b
It works with FWH only, because it uses FWH components
Re: More details WIN_OLEAUTO information in debugger
Posted: Sun Jul 12, 2020 11:39 am
by FWExplorer
Perfect, I'll take a look, thanks.
Antonio Linares wrote:FWH has its own debugger, you only have to build using /b, in example:
buildh tutor01 /b
It works with FWH only, because it uses FWH components
Re: More details WIN_OLEAUTO information in debugger
Posted: Sun Jul 12, 2020 1:51 pm
by cnavarro
Re: More details WIN_OLEAUTO information in debugger
Posted: Thu Jul 16, 2020 5:37 pm
by FWExplorer
Ok, thanks Antonio.